Data Science & Developer Roadmaps with Chat & Free Learning Resources

Building Dashboards using Dash (< 200 lines of code)
Dashboards are user interfaces (UIs) that visualize data in an organized manner. Business dashboards usually contain information around Key Performance Indicators (KPIs) related to particular…
Read more at Towards Data Science | Find similar documents
Building Dashboards in Dash
Dashboards are a quick and effective way to utilize your data. With Plotly and Dash, building dashboards in Python has never been more straightforward.
Read more at Towards Data Science | Find similar documents
Build Dashboards in Less Than 10 Lines of Code!
Machine Learning Dashboards are a great way to interpret models. These usually describe the inner working of the model and provides interactive plots to discover model performance, feature…
Read more at Towards Data Science | Find similar documents
How to use Docker to deploy a Dashboard app on AWS
Dashboards are a fantastic way of exploring both data and model behaviour. They are also an indispensable tool in communicating with both technical and non-technical stakeholders. I’m assuming that…
Read more at Towards Data Science | Find similar documents
Creating Dashboards in R
Dashboards are a great way to demonstrate knowledge and engage decision makers. Their utility has made PowerBI and Tableau household names. And while these solutions do support R and Python scripts an...
Read more at R-bloggers | Find similar documents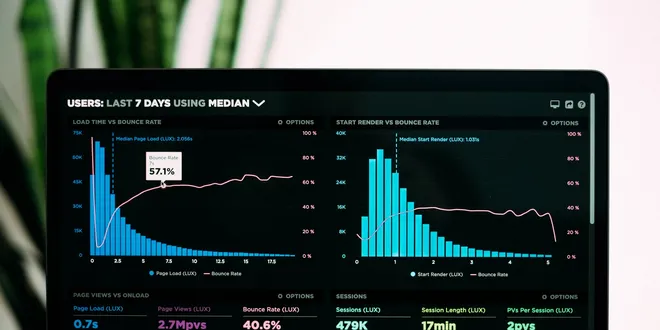
Creating Dashboards in R
Dashboards are a great way to demonstrate knowledge and engage decision makers. Their utility has made PowerBI and Tableau household names. And while these solutions do support R and Python scripts an...
Read more at R-bloggers | Find similar documents
Comparison between ArcGIS Dashboard, Tableau Dashboard, and R Flexdashboard
Dashboards provide enhanced data visibility and help businesses to achieve deeper insights. The market, however, is flooded with many tools and softwares that can be used to create dashboards. As a…
Read more at Towards Data Science | Find similar documents
Creating Dashboards in R
Dashboards are a great way to demonstrate knowledge and engage decision makers. Their utility has made PowerBI and Tableau household names. And while these solutions do support R and Python scripts an...
Read more at R-bloggers | Find similar documents
How to Make Impressive Dashboards in Under 10 Minutes with Shiny
Dashboards allow you to structure reports intuitively and break them down into easy-to-read chunks. As a result, end-users can navigate and explore data much easier than with traditional reports. The…...
Read more at Towards Data Science | Find similar documents
Lean Dashboards: Data Inclusion & Exclusion Principles
Dashboards bring data and visualization to users in an interactive fashion and hence get a lot of likes and popularity. To keep dashboards story-telling power strong, I conclude a healthy amount of…
Read more at Towards Data Science | Find similar documents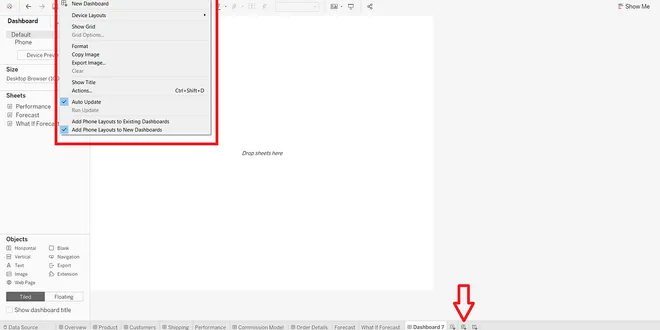
Tableau Dashboarding
Let us start by learning how to navigate on a new dashboard, understand its sections and panes, and then advance on learning to make perfect dashboards..! As stated by Klipfolio, a dashboard is a…
Read more at Analytics Vidhya | Find similar documents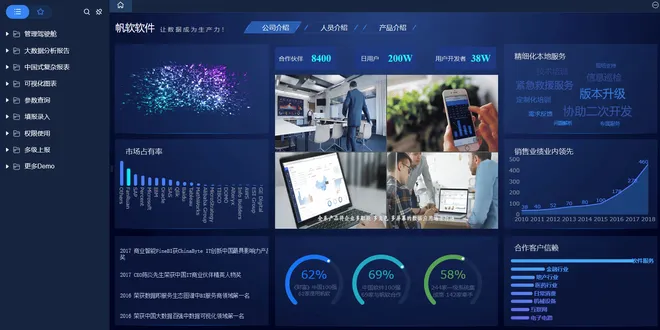
A Beginner’s Guide to Business Dashboards
Speaking of the dashboard, you may think of the instrument panel of an airplane or a car dashboard, where drivers monitor the major functions at a glance via the instrument cluster. In the field of…
Read more at Towards Data Science | Find similar documents- «
- ‹
- …