Data Science & Developer Roadmaps with Chat & Free Learning Resources

Interactive Ternary Plots with Plotly
Plotly Python (plotly.py) is an open-source plotting library built on plotly javascript (plotly.js). One of the things I like about plotly.py is that it offers a high-level API (plotly express) and a…...
Read more at Towards Data Science | Find similar documents
Library of the week #8: Plotly
Why Plotly? When it comes to data visualization in Python, you want a library that offers both versatility and user-friendly interactive features. That’s where Plotly shines. Whether you’re just getti...
Read more at Python in Plain English | Find similar documents
Interactive Distribution Plots with Plotly
Plotly Python (plotly.py) is an open-source plotting library built on plotly javascript (plotly.js). Plotly express is a high-level interface of plotly.py that allows us to create many interactive…
Read more at Towards Data Science | Find similar documents
Interactive Visualizations with Plotly
Plotly Python (plotly.py) is an open-source plotting library built on plotly javascript (plotly.js). It allows to create interactive visualizations that can be displayed in Jupyter notebooks. It can…
Read more at Towards Data Science | Find similar documents
Get Started with Plotly @ Jupyter Lab
What is Plotly? It’s an interactive Python graphing library. You can make many beautiful and engaging charts using Plotly, such as line plots, scatter plots, box plots, histograms, and heatmaps.
Read more at Analytics Vidhya | Find similar documents
Representing 5 Features in a single animated plot using Plotly
Plotly is a visualisation library which is fast becoming popular for its amazing capabilities. What sets Plotly apart from the other visualisation libraries is its ability to provide interactive…
Read more at Towards Data Science | Find similar documents
Scatter Plots on Maps using Plotly
Plotly is a powerful visualisation library that provides amazing capabilities like interactive, dynamic, easy to use, and highly detailed plots. Plotly Express is a built-in part of the Plotly…
Read more at Towards Data Science | Find similar documents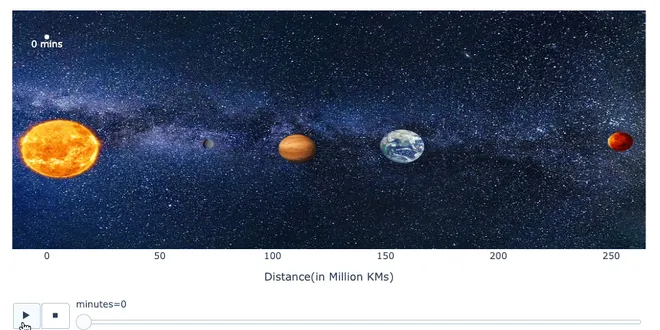
A Lesser-known Feature of Creating Plots with Plotly
Plotly is pretty diverse when it comes to creating different types of charts. While many folks prefer it for interactivity, you can also use it to create animated plots. Here's an animated visualizati...
Read more at Daily Dose of Data Science | Find similar documents
Python Plotly Library: Exploring Data Visualization with Plotly
What is Plotly? Plotly is an open-source Python library that specializes in creating interactive visualizations for web applications, notebooks, and dashboards. It supports a variety of chart types, i...
Read more at Python in Plain English | Find similar documents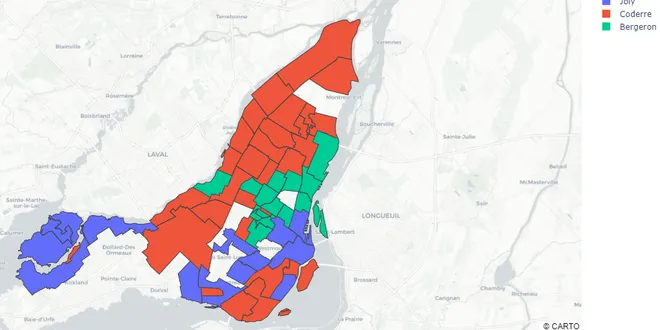
Creating Geographical Plots Using Plotly
Plotly is an open-source library that creates high-level interactive graphs it can be used to plot various types of graphs and charts easily. Creating a geographical plot has never been so easy…
Read more at Towards Data Science | Find similar documents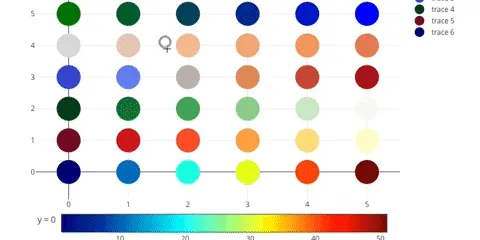
How to Use the Plotly Charting Library in React App
Plotly is a computing company headquartered in Montreal, Quebec, that develops online data analytics and visualization tools. It provides online graphing, analytics, and statistics tools for…
Read more at Better Programming | Find similar documents
Python:Plotly
Plotly is a Python library for creating interactive visualizations and charts, offering a variety of visualization options like line graphs , bar charts , heatmaps , and scatter plots . Installation T...
Read more at Codecademy | Find similar documents- «
- ‹
- …