Data Science & Developer Roadmaps with Chat & Free Learning Resources
Seaborn Ultimate Cheat Sheet (2021)
Seaborn is a library for creating beautiful visualizations in Python. It is built on top of matplotlib and provides a high-level API for drawing pretty statistical graphs. At first, using the library…...
Read more at Level Up Coding | Find similar documents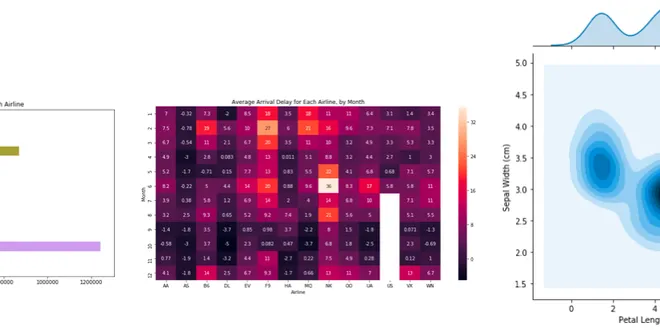
Hello, Seaborn
Welcome to Data Visualization! In this hands-on course, you'll learn how to take your data visualizations to the next level with [seaborn](https://seaborn.pydata.org/index.html), a powerful but easy-...
Read more at Kaggle Learn Courses | Find similar documents
Hello, Seaborn
Welcome to Data Visualization! In this hands-on course, you'll learn how to take your data visualizations to the next level with [seaborn](https://seaborn.pydata.org/index.html), a powerful but easy-...
Read more at Kaggle Learn Courses | Find similar documents
Hello, Seaborn
Welcome to Data Visualization! In this hands-on course, you'll learn how to take your data visualizations to the next level with [seaborn](https://seaborn.pydata.org/index.html), a powerful but easy-...
Read more at Kaggle Learn Courses | Find similar documents
Basic Seaborn Guide
Seaborn is a visualisation library that sits on top of matplotlib, making it nicer to look at and adding some extra capabilities too. Data visualisation allows data scientists to communicate their…
Read more at Towards Data Science | Find similar documents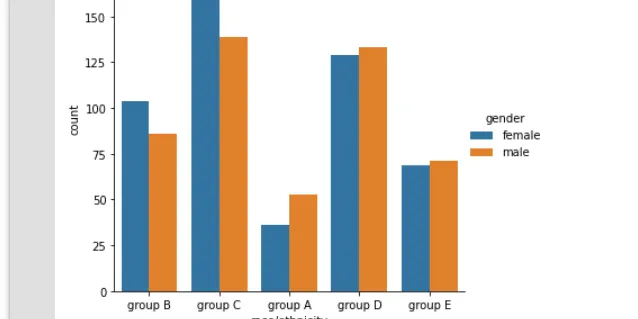
Categorical Plots in Seaborn
Seaborn is a data visualization library of Python similar to other visualization libraries like Matplotlib and Plotly. It is based on Matplotlib library. Seaborn is a powerful Python library that…
Read more at Analytics Vidhya | Find similar documents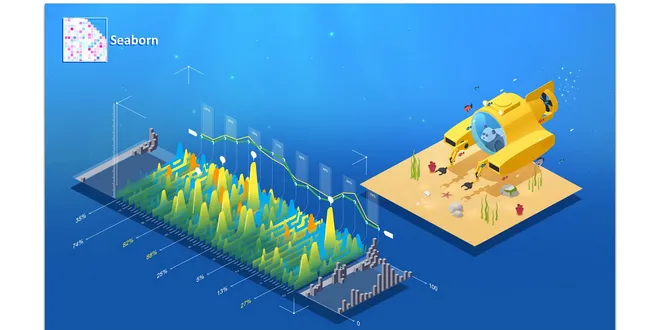
Plotting with Seaborn: Part 1
Seaborn is a library for making statistical graphics in Python. It builds on top of matplotlib and integrates closely with pandas data structures. Seaborn helps you explore and understand your data…
Read more at Analytics Vidhya | Find similar documents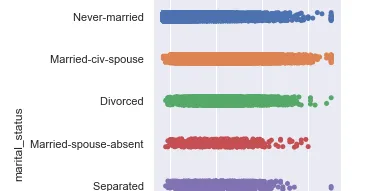
Data Visualization using Seaborn
Seaborn is a Python data visualization library based on matplotlib. It provides a high-level interface for drawing attractive and informative statistical graphics. Note: This article assumes you are…
Read more at Towards Data Science | Find similar documents
How to use Seaborn for Data Visualization
Seaborn is an open-source Python library built on top of matplotlib. It is used for data visualization and exploratory data analysis. Seaborn works easily with dataframes and the Pandas library. The…
Read more at Towards Data Science | Find similar documents
Beginner’s Guide to Visualizations with Seaborn
Getting started with Data Visualization with Seaborn Photo by NEW DATA SERVICES on Unsplash Data visualization is a great way to make sense of data and share it with others. It helps you see patterns...
Read more at Python in Plain English | Find similar documents
Seaborn: Python
Seaborn is a data visualization library built on top of matplotlib and closely integrated with pandas data structures in Python. Visualization is the central part of Seaborn which helps in…
Read more at Towards Data Science | Find similar documents
8 Soundest Seaborn Visualizations
Hands-on statistical plots with Seaborn using the penguin dataset. Blog Thumbnail made via Canva To do a project in data science, you first need to understand data. Data visualization is one of the b...
Read more at Level Up Coding | Find similar documents- «
- ‹
- …